|
|
| Photo: Iowa Public Television. |
Introduction
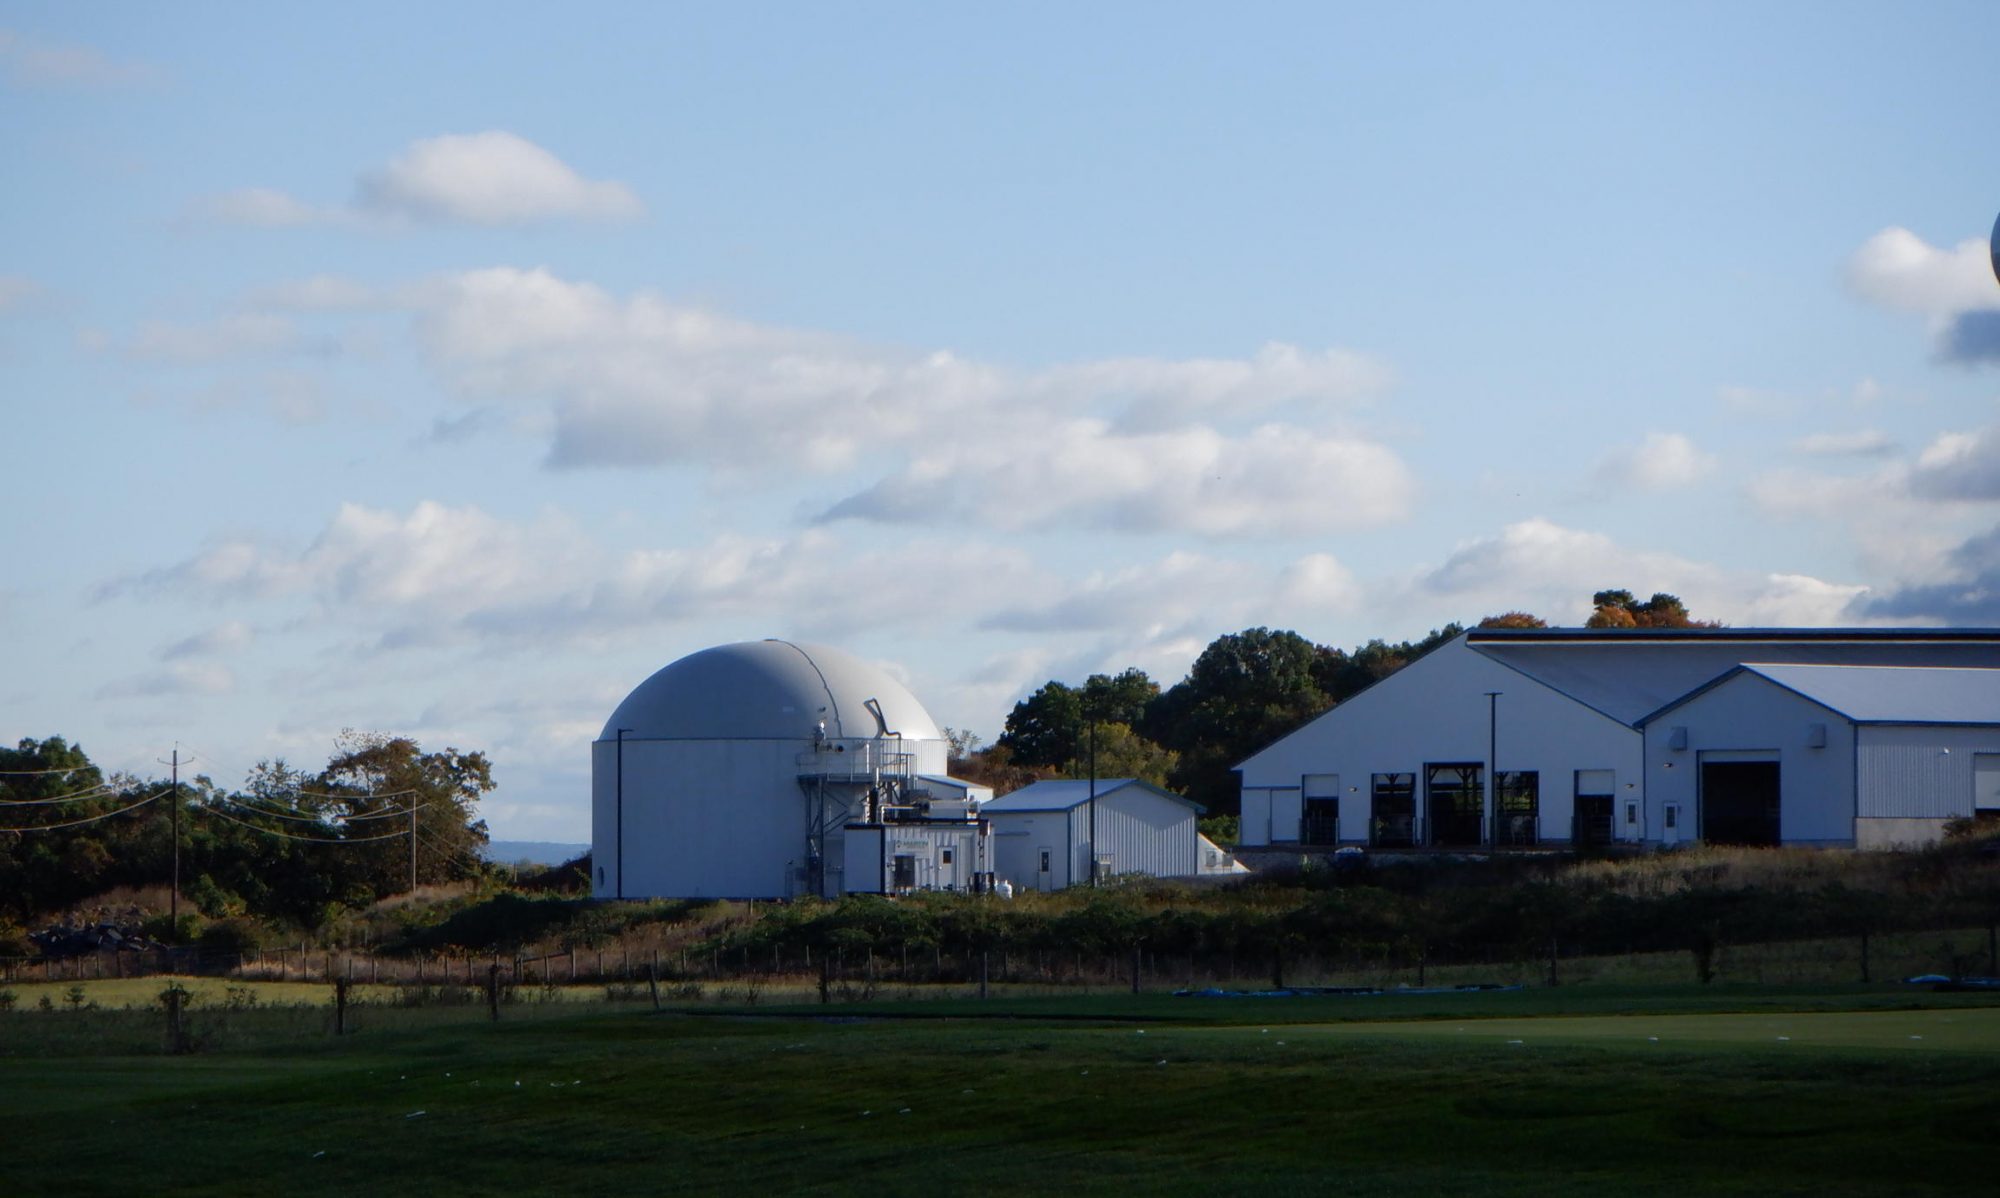
The Nebraska Tractor Test Laboratory (NTTL) at the University of Nebraska is the official tractor testing station for the Organization for Economic Cooperation and Development (OECD) in the United States. This independent laboratory is responsible for testing a representative tractor of each model sold in the state of Nebraska. It also tests tractors manufactured in the United States and sold in international markets. The laboratory publishes the results of all tests conducted.
The test reports published by NTTL can be extremely useful in the selection of tractors or for comparing the performance of different makes and models of tractors. For example, when a farmer is in the market for a tractor, the performance data in the test reports can be used to select a tractor that will meet his/her needs. Farmers who are more informed about the performance characteristics of tractors already owned will be able to operate in the most efficient range and select equipment sizes that complement and optimize their tractor’s capabilities. These reports can also serve as an effective tool for making tractor sales. Dealership personnel can use the performance data to compare their products to those of competitors.
For either application, familiarity with the content of the test reports and the know-how to use the information effectively are essential.
|
|
| Photo: Iowa Public Television. |
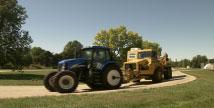
Nebraska Tractor Test Laboratory (NTTL)
NTTL, the official tractor testing laboratory in the United States, is a member of the OECD with 27 other countries. The OECD recommends that all tractors manufactured in member countries be tested in the country where they are manufactured, following the OECD guidelines. Based on an established agreement among member countries, test reports approved by OECD are accepted by all participating countries.
|
|
| Photo: Iowa Public Television. |
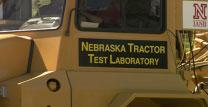
Tractor Tests
The purpose of the tests is to collect data that can be used to assess the performance of tractors of different makes and models. For this reason, all tests are conducted under the same or similar test conditions and procedures. Tractor tests are generally conducted to assess the PTO (power take-off) performance, drawbar performance, hydraulic lift capacity, and hydraulic system pressure and flow. In addition, sound level measurements are also taken at operator and bystander locations.
PTO performance tests are conducted with a dynamometer attached to the tractor PTO. The purpose of the dynamometer is to apply varying loads through the PTO and to measure the power generated by the tractor. These tests are conducted at ambient temperature of 75°F and a barometer reading above 28.5 inches of mercury. During tests, when the tractor performance has stabilized, the data are recorded at predetermined intervals.
The load applied by the dynamometer follows the operating curve of the engine at full throttle. Data collected include torque, rpm, power, and fuel consumption. A series of PTO tests are conducted for these parameters:
- at rated engine speed,
- at standard PTO speed (either 1,000 or 540 rpm),
- at the engine speed where maximum power is produced,
- at varying loads, and
- at maximum torque.
Drawbar performance tests are conducted in all gears between one gear below the one which provided maximum drawbar force (without exceeding a wheel slip of 15%) and a maximum speed of 10 miles per hour. In each gear, at full throttle, the load is increased until maximum drawbar power is achieved. Engine speed, wheel slip, and fuel consumption data are recorded when test conditions are stabilized.
Drawbar tests are also conducted with partial loads at 75% and 50% of the maximum drawbar load (at rated engine speed). These partial load tests are also conducted at reduced engine speeds (selected by the manufacturer).
Hydraulic lift capacity and flow tests are conducted to determine the maximum lift capacity of the hydraulic system through the full lift range. The lift capacity in the report is 90% of the maximum load carried through the full lift range.
Additional tests are also conducted to determine the pressure-flow relationship of the hydraulic system for supplying power to external actuators (such as motors or cylinders). Reports include data on delivery rate, pressure, and available power.
Sound level measurements during performance tests are taken at the operator and bystander locations. At the bystander location, the readings are taken by locating the microphone 25 feet from the center line of the tractor. Sound levels are recorded using “A” scale in the sound level meter and is expressed in terms of dB(A). The “A” scale is a filter that responds like a human ear.
|
|
| Photo: Iowa Public Television. |

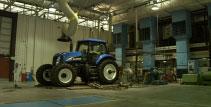
Nebraska Test Reports
Nebraska law mandates the NTTL to publish the test results on all tractors sold in the state of Nebraska which may include tractors tested at the NTTL or by one of the OECD partners. A full OECD report is generally 30 pages long. NTTL summarizes and publishes the test results in two formats (to order, see contact information below). The first format is a booklet (4 inches x 6.5 inches) published annually with limited performance data on all tractors available for sale that year in the state of Nebraska. The summary booklet generally includes approximately 400 tractor models from different manufacturers. The second format is a more detailed report (typically two to six pages) covering individual tractor test results.
Annual Summary Booklets
The cover of the summary booklet provides the year in which the tractors were tested. A typical page provides the summary of test results of two or three tractors from a manufacturer. Included in the summary is information on tractor model, limited engine and chassis specifications, PTO and drawbar performance data, sound level, three-point lift capacity, and hydraulic system parameters. The summary booklets are particularly useful for an initial review of the performance of tractors of different sizes produced by different manufacturers.
Summary Report for a Specific Tractor
When the initial review generates interest in a particular tractor model, a user can obtain a summary report specific to that model tractor. The first page of the summary report provides information on test number, make and model of tractor tested, and transmission. It also includes results of PTO and drawbar performance tests in addition to tractor specifications in a column located on the right-hand side of the page. Fuel consumption is reported in three different ways: gal/hr, lb/hp∙hr, and hp∙hr/gal. Fuel consumption expressed in terms of hp-hr/gal is useful for comparing fuel consumption of tractors of different sizes. PTO tests at varying power levels simulate a wide range of field operations using the tractor.
The drawbar performance data include drawbar power and pull, forward speed, wheel slip, engine speed, fuel consumption, temperature and relative humidity conditions at maximum, 75% and 50% pull at maximum power. The tests at reduced engine speed also include similar data at various travel speeds.
Power measured at 75% of pull at maximum power may represent a typical operation with heavy load such as primary tillage. At 75% pull, the tractor may still have some reserve power to overcome unexpected overload situations. The average fuel consumption at 75% and 50% pull may represent tillage and seeding operations, respectively, on small grain farms.
Similarly, the average fuel consumption at the 50% pull tests can serve as a good estimate of fuel consumption when tractors are used in row-crop farming. This distinction between small-grain and row-crop production is made because more efficient tractor-implement matching is possible for small grain production. For small-grain applications, implements to utilize the available tractor power can be selected more easily. However, the same conclusion may not be true in the case of row-crop implements.
Tractor tests are conducted on concrete or asphalt tracks. Therefore, the performance data recorded during these tests can be significantly better than what can be expected under normal field conditions. Tests are conducted on hard surface (concrete and asphalt) for consistency between tests.
Sound levels, tire, and weight information are also provided. Tractor sound level at the operator’s ear location is critical because Occupational Safety and Health Administration (OSHA) has strict sound level and exposure time regulations. For example, OSHA permits an eight-hour exposure period if the sound level in the work area is 90 dB(A).
Due to the fact that a 3 dB(A) increase in sound level corresponds to doubling of sound pressure level, for every 5 dB(A) rise in sound level, the permissible exposure time is cut in half. In other words, at 95 dB(A), the allowable exposure time is only 4 hours. It is not uncommon to have tractor sound levels reaching 95 dB(A).
If the tractor tested has front wheel assist, additional drawbar tests with the front wheel assist disengaged may follow. The last page of the report is devoted to three-point hitch performance data, hydraulic system parameters, and hitch dimensions.
Published tractor test results can also be used for estimating annual fuel consumption by knowing how the tractors are used during the year. This information is particularly useful for budgeting and management purposes.
Using the Test Reports for Tractor Selection
Many factors are considered in the selection and purchase of a new tractor, including types of jobs to be performed, price, proximity and reputation of the dealership, desired power output at the drawbar and PTO, hydraulic system capacity, and fuel efficiency. The tractor test reports can play an important role in the decision-making process. Both summary booklets and summary reports on individual tractors are useful in selecting tractor models or for evaluating and comparing performance of different tractor models.
Steps in Selecting a Tractor
► The first step in the tractor selection process is to evaluate the need that exists. Depending on the needs identified, the purchaser should estimate the power requirements at the PTO and drawbar.
► After estimating the power requirements, identify tractor models that are capable of providing the required output power. This list may include tractors from different manufacturers if more than one dealership is available nearby.
► Compare the performance data of the tractor models identified. It may help to prepare a table that includes performance variables plus any other variables that are pertinent to the selection process. The number of additional columns will depend on the number of tractor models identified during initial screening. The data for each column can be extracted from the test reports. This table allows easy comparison among several tractor models. The tractor information available in the summary reports may be used for the final selection. Consider such factors as:
- stability,
- tire size,
- tractor configuration (2WD, FWA, 4WD),
- repair frequency,
- proximity and reputation of dealership, and
- price.
An Example
To illustrate the step-by-step procedure for selecting a tractor using the Nebraska Tractor Test data, consider the following hypothetical example. A farmer is interested in selecting a new tractor for his or her orchard/vegetable operation. To select the tractor for this operation, s/he follows the step-by-step procedure established earlier.
Step 1. Evaluate the need and estimate the power requirement. Consider all the different operations that need to be carried out using the new tractor during the year. It is estimated that the new tractor should have a minimum rated PTO power of 70 hp.
Step 2. Identify all tractor models meeting the power requirement. A review of “Nebraska and OECD Tractor Test Data for 2007” summary booklet (MP-37) showed that 17 different tractor models will meet the power requirement.
Step 3. Prepare a table to compare the performance data of tractors identified. Table 1 summarizes the performance data of the 17 tractor models identified from the summary booklet.

Final selection of a tractor model depends on many other factors such as cost, personal preference, dealership location, safety features, fuel consumption, sound level readings, and hydraulic system capacity. For example, two service centers/dealerships (Case-IH and John Deere) are located within 20 miles of the farm. If proximity of dealership is important to the farmer, the list is reduced to six models from Case-IH and John Deere. With the list narrowed to six tractor models, the final selection may be made taking the factors listed earlier into consideration.
Summary Reports for tractors tested since 1999 can be found, for no charge, at: The Nebraska Tractor Test Laboratory.
While the NTTL data provided can help farmers select which tractor their operation needs, it can also be used to evaluate many energy decisions confronting farmers. For example, how much more can a farmer afford to pay for a more fuel-efficent tractor? Producers can calculate the operating and ownership costs of the tractor model they are considering to answer this question and then compare those costs with their present equipment. A spreadsheet tool prepared by University of Minnesota economist, Bill Lazarus called Machinery Cost Calulator is useful for this analysis. Rather than use default values provided, NTTL data for the specific tractor model under consideration can be substituted to provide more accurate information for farmers.
Additional Resources
- Introduction to Energy-Efficient Tractor and Field Operations
- Tractor and Field Operations Energy Efficiency Checklist and Tips
- Introduction to Farm Equipment Energy Efficiency
- Reducing Tillage to Save Fuel
- Gear Up and Throttle Back to Save Fuel
- Optimize Wheel Slip to Save Fuel
- Ballasting Tractors for Optimal Fuel Efficiency
- Match Implement Size to Tractor to Save Fuel
- Optimizing Field Efficiency to Save Fuel
- Machinery Maintenance for Energy Efficiency
- Five Strategies for Extending Machinery Life by R. Grisso and R. Pitman, Virginia Cooperative Extension.
- Machine Cost Estimates by William F. Lazarus, University of Minnesota.
For Tractor Test Information Contact:
- University of Nebraska Tractor Test Laboratory 35 & East Campus Loop P.O. Box 830832 Lincoln, NE 68583-0832 (402) 472-2442 Fax: (402) 472-8367 email: tractortestlab@unl.edu
Contributors to This Article
Authors
- Robert Grisso, Extension Engineer, Virginia Tech
- David H. Vaughan, Virginia Tech
- John V. Perumpral, Virginia Tech
- Gary T. Roberson, North Carolina State University
- Robert Pitman, Agricultural Engineer, Virginia Tech
- Roger M. Hoy, University of Nebraska
Peer Reviewers
- Cole Gustafson, Biofuels Economist, North Dakota State University
- Scott Sanford, Senior Outreach Specialist, University of Wisconsin – Madison
- Zhiyou Wen, Biological Systems Engineering Department, Virginia Tech
- David Moore,Virginia Cooperative Extension
- Matthew Lewis, Virginia Cooperative Extension
- Christian Mariger, Virginia Tech